Dagelijkse gratis limiet bereikt. Neem een abonnement om verder te gaan.
Meer dan een miljoen beleggers sloten zich al bij ons aan. Kopieer net als zij onze prestaties of identificeer gemakkelijk de beste beleggingen van morgen dankzij onze tools, adviezen en analyses van experts.
Maandabonnement
Jaarlijks
-20%
Access
Informatie en data voor de veeleisende belegger die zelfstandig denkt
Access
-17%
24
29€€/maand
24
29€€/maand
Informatie en data voor de veeleisende belegger die zelfstandig denkt
Reële portefeuilles om te kopiëren (Europa, VS, Azië)
Ontdek de concrete beleggingsbeslissingen die van ons een bekende speler hebben gemaakt.
Volg in volledige transparantie onze posities en de prestaties van onze drie portefeuilles belegd op beurzen in Europa, de VS en Azië. Onze prestaties zijn reëel, exclusief makelaarskosten en transactiebelastingen.
Onze portefeuilles bestaan uit liquide bedrijven.
De aandelen zijn gespreid over landen en sectoren om het risico te beperken.
Je wordt op de hoogte gebracht van elke door ons uitgevoerde transactie.
Gemiddeld twee transacties per maand per portefeuille.
Onze transacties zijn niet gebaseerd op market timing.
*In het verleden behaalde resultaten bieden geen garantie voor de toekomst.
Een mondiale databank zonder weerga
Onze databank is dé referentie voor veeleisende beleggers. Onze databank wordt gevoed met de beste bronnen en dekt alle markten en alle genoteerde instrumenten. Of je nu jouw portefeuille wilt volgen, een sector in de gaten wilt houden of op zoek bent naar nieuwe kansen: ons platform biedt je een volledig overzicht op één plek.
Mondiale koersen: aandelen, indexen, obligaties, valuta, grondstoffen, ETF's...
Bedrijfsdata die 10 jaar bestrijken: gepubliceerde, historische en vergelijkende jaarrekeningen.
Schattingen en consensus van analisten: verwachtingen, herzieningen, verrassingen en trends.
Dividenden en rendementen: historische data en vergelijkende analyse.
Segmentatie van de omzet per activiteit en geografische gebieden.
Een complete agenda: kalender van bedrijven en macro-economische aankondigingen.
Beslissers en aandeelhouders: biografische informatie, netwerken en verdeling.
Sectorvergelijking: classificaties, benchmarks en kruisanalyses.
Insidertransacties: aankopen en verkopen door bestuurders.
ESG: MSCI-beoordelingen en exclusieve fundamentele beoordelingen van MarketScreener.
Toonaangevende media en ongeëvenaarde diepgang van informatie
MarketScreener is het toonaangevende medium voor het volgen van de financiële beurzen. Profiteer van onze onafhankelijkheid en expertise met een totaaloverzicht: aandelen, ETF's, sectoren, economie, indices, valuta's, cryptovaluta's, grondstoffen.
Ons informatieaanbod wordt maandelijks door miljoenen beleggers in meer dan 90 landen gebruikt en staat wereldwijd bekend om zijn betrouwbaarheid, reactiesnelheid, dekking en toegevoegde waarde.
Krijg een beter inzicht met onze artikelen, analyses en interpretaties, geschreven door ons team van journalisten, analisten en wetenschappers, allen experts op het gebied van financiële markten.
Volg de markten in real-time dankzij nieuwsfeeds uit de beste bronnen wereldwijd, beschikbaar in zeven talen en automatisch vertaald voor onmiddellijk leesplezier.
Beschik over de meest uitgebreide documentatie die online beschikbaar is. Krijg toegang tot een ongeëvenaarde schat aan informatie om je aandelen, sectoren of specifieke bedrijven te volgen.
Bekijk de samenvattingen van onze journalisten die vroeg opstaan en laat naar bed gaan om jou nauwkeurig op de hoogte te houden en tijd te besparen.
De experts van MarketScreener leveren dagelijks analyses en adviezen. Zo kan je bedrijven ontdekken of herontdekken waarin je kan beleggen of die je net beter kan vermijden.
Onze diepgaande artikelen zijn geschreven door ons team van experts en helpen je bij het nemen van beslissingen en het begrijpen van onze keuzes.
Wij selecteren kwaliteitsbedrijven, d.w.z. bedrijven die groeien en winst maken zonder buitensporig gebruik te maken van schulden, en die een redelijke waardering genieten in verhouding tot hun voordelen. De tijd speelt in hun voordeel.
Wij volgen continu 70 beleggingsthema's die in het nieuws zijn of aansluiten bij fundamentele trends.
Bekijk onze lijsten met aandelen in de vorm van portefeuilles met hun rendement, sectorale en geografische spreiding. Elk thema wordt uitgebreid toegelicht en de lijsten met bedrijven worden zeer regelmatig bijgewerkt.
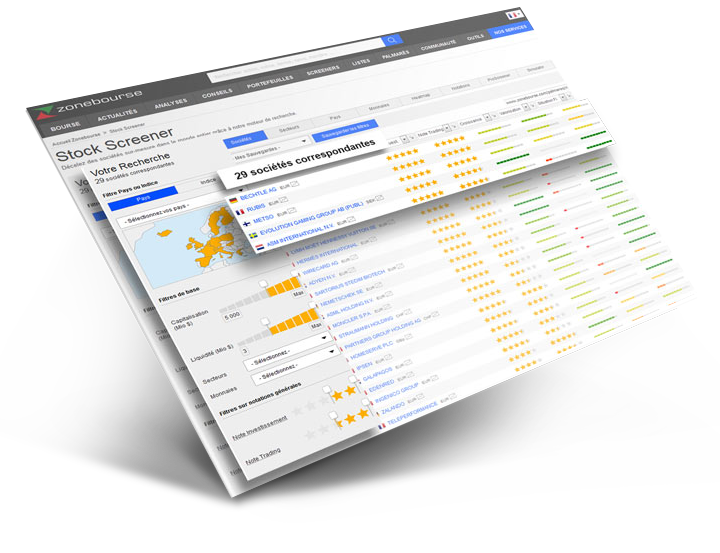
Allicht de krachtigste aandelenscreener op de markt.
Analyseer in enkele seconden alle beursgenoteerde bedrijven wereldwijd, ongeacht sector, indices of valuta's.
Meer dan 650 fundamentele en technische criteria die zijn afgestemd op jouw beleggingsstrategieën.
Filter op basis van honderden financiële, consensusgerelateerde, technische of ESG-criteria en verkrijg zo een compleet overzicht van de geanalyseerde bedrijven.
Volg je aandelen of importeer je gegevens om je beleggingen efficiënt te beheren met behulp van onze tools, databanken en nieuwsberichten:
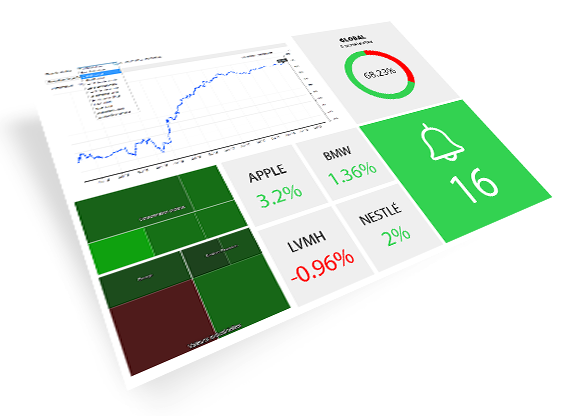
Maak tot 10 lijsten van 50 aandelen aan om je favoriete bedrijven te volgen: real-time koersen, informatie, resultaatrapportages, evolutie van ramingen, aanbevelingen van makelaars.
Net als grote beleggers en professionele analisten kan ook jij je een goed beeld vormen van bedrijven door toegang te krijgen tot transcripties van resultaten, beleggersmomenten of presentaties van het bedrijf.
Elke transcriptie is gestructureerd en georganiseerd zodat je gemakkelijk kunt navigeren tussen de verklaringen van leidinggevenden en de vragen van analisten of beleggers.
Je vindt er ook een analyse van de positiviteit van de inhoud, evenals een rangschikking van de gebruikte trefwoorden.
Altijd up-to-date en ideaal voor fundamentele analyse en het genereren van ideeën. Om af te drukken, te voorzien van notities, te delen of op te slaan voor direct gebruik, voor een vergadering of voor je beleggingskring.
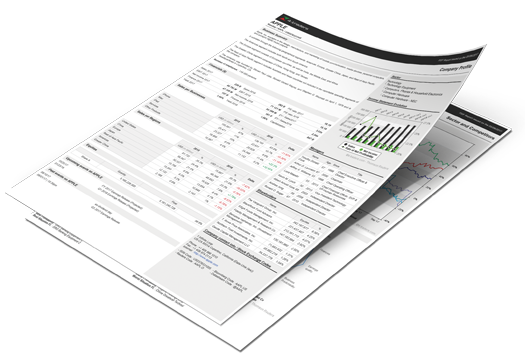
De beknopte rapporten van 6 pagina's kunnen worden gedownload en zijn beschikbaar voor meer dan 60.000 beursgenoteerde ondernemingen. Ze bevatten alle gedetailleerde informatie en bieden een volledig overzicht van elk bedrijf:
Het Access-abonnement is afgestemd op de veeleisende autonome belegger die op zoek is naar informatie en data. Je Access-abonnement omvat een groot aantal voordelen, waaronder:
Onbeperkt navigeren zonder advertenties en met onbeperkte toegang tot al het nieuws en alle artikelen en analyses van MarketScreener.
Gratis toegang tot ons wekelijkse beursoverzicht.
Al onze betalende gidsen kostenloos downloaden vanuit je MarketScreener-account.
Toegang tot de portefeuillemanager.
Een klantendienst die je helpt en begeleidt.
Gratis toegang tot de betalende iPhone-applicatie van Marketscreener.
Toegang tot een groot aantal thematische beleggingslijsten, lijsten van aandelen specifiek samengesteld voor een beleggingsstijl (aandelen: groei, voordelig genoteerd, dividend, kwaliteit, ESG, multibagger, offensief, dynamisch, enz.)
Toegang tot meer dan 50 aandelenlijsten ingedeeld volgens hun sector van blootstelling of een bepaald thema (zonne-energie, windenergie, videogames en e-sports, defensie, waterstof, internet, kunstmatige intelligentie, robotica, e-commerce, fintechs, blockchain, strategische of zeldzame metalen, enz.)
Toegang tot de meest geavanceerde aandelenscreener op de markt waarmee je alle bedrijven rangschikt en vergelijkt
Exclusieve rangschikking van bedrijven (beleggings- en handelsscores beschikbaar via onze aandelenscreener) op basis van een groot aantal criteria (groei, waardering, WPA-beoordeling op lange termijn, financiële situatie, winstgevendheid, bekendmakingen en zichtbaarheid, WPA-beoordeling op korte termijn, enz.) waardoor onze klanten snel de bedrijven kunnen identificeren die wij als lange- of kortetermijnbeleggingen classificeren.
Automatisch genereren van financiële rapporten in pdf-formaat van alle beursgenoteerde bedrijven wereldwijd
Uitgebreide toegang tot gepersonaliseerde lijsten (10 * 50 aandelen)
Uitgebreide toegang tot virtuele portefeuilles (10 * 50 aandelen)
Toegang tot honderden fundamentele parameters
Fundamentele data van institutionele kwaliteit, afkomstig van de meest betrouwbare en gerenommeerde aanbieders van financiële data en beursgegevens ter wereld (zoals Refinitiv, S&P Global, MorningStar, Factset, etc.)
Wat is er inbegrepen in mijn Premium-abonnement?
Het Premium-abonnement is bestemd voor beleggers die onze adviezen en beslissingen op de beurs willen volgen Je Premium-abonnement omvat een hele reeks voordelen:
Alle tools, diensten en inhoud van het Access-abonnement
Onbeperkte toegang tot alle beursadviezen van onze experts om je te helpen de prestaties van je beleggingen te optimaliseren
Toegang tot de drie reële Europese/Amerikaanse/Aziatische portefeuilles waarin wij effectief beleggen, zodat je zelf onze beleggen kan volgen, onze portefeuilles kan kopiëren en de markten kan verslaan
Onbeperkte toegang tot de meest geavanceerde aandelenscreener op de markt, waarmee je alle bedrijven kan rangschikken en vergelijken
Onbeperkt aanmaken van financiële rapporten in pdf over alle beursgenoteerde bedrijven wereldwijd
Toegang tot het Premium-beursnieuws
Met deze formule optimaliseer je het rendement van je beleggingen en vergroot je de kans om de markten te verslaan.
Wat is er inbegrepen in mijn Expert-abonnement?
Het Expert-abonnement is bedoeld voor beleggers die op zoek zijn naar besluitvormingstools voor beleggingsexperts
Je Expert-abonnement omvat een hele reeks voordelen:
Alle tools, diensten en inhoud van het Premium-abonnement
Gepersonaliseerde telefonische ondersteuning, rechtstreeks van onze experts
Toegang tot de Pro-versie van de aandelenscreener
Toegang tot de evenementenscreener
Onbeperkte toegang tot het automatisch genereren van financiële rapporten in pdf-formaat over alle beursgenoteerde bedrijven wereldwijd en de mogelijkheid om de financiële rapportagesjablonen aan te passen
Uitgebreide toegang tot gepersonaliseerde lijsten (50 * 500 waarden)
Uitgebreide toegang tot virtuele portefeuilles (20 * 100 aandelen)
Deze formule helpt je nieuwe hoogten te bereiken met je beleggingsprestaties en je beurskennis en inzicht in de aandelenmarkten sterk te verbeteren.
Wat rechtvaardigt de prijs van jullie abonnementen?
MarketScreener biedt de beste verhouding tussen kwantiteit, kwaliteit en prijs.
Andere bedrijven bieden misschien goedkopere abonnementen aan, maar geen enkele heeft een dermate compleet aanbod van informatie, tools, analyses, adviezen en reëel belegde portefeuilles als MarketScreener.
MarketScreener biedt de meest complete service aan om te beleggen op de beurs.
Al het beursnieuws wereldwijd en live
Exclusieve inhoud van MarketScreener met hoge toegevoegde waarde, waaronder onze analyses en beleggingsadviezen
Een ongeëvenaarde databank die meer dan 99,9 % van alle beursgenoteerde bedrijven ter wereld dekt
De beste tools voor beursanalyse en aandelenscreening, waarmee de belegger alles in huis haalt om te kunnen beleggen op de beurs
Drie portefeuilles: een Europese, Amerikaanse en Aziatische. Reëel belegd zodat jij onze beleggingen kan kopiëren en net zoals wij een rendement kan behalen dat boven dat van de wereldmarkten ligt
De meest complete beursapplicatie van de markt
MarketScreener biedt zijn gebruikers duidelijke, gebruiksvriendelijke, kwalitatief hoogstaande en diepgaande data aan, zodat zij beter kunnen presteren dan de markt en het type belegger kunnen worden dat zij willen zijn.
Hoe komt het dat jullie zoveel tools en kwaliteitsinhoud kunnen aanbieden?
Elke belegger verdient kwaliteitsinformatie op basis van betrouwbare data. Omdat wij al sinds 2001 bestaan, hebben wij de afgelopen 20 jaar continu de instrumenten gecreëerd die wij nodig hebben om de markten te volgen, te analyseren en te doorgronden, en om onze portefeuilles goed te doen presteren. Dat is ook de reden waarom onze instrumenten zo nuttig en performant zijn: zij komen voort uit de reële behoeften van de slimme belegger.
Wat de kwaliteit van onze inhoud betreft, hebben wij geleidelijk teams van analisten en journalisten opgebouwd, zodat onze klanten dagelijks exclusieve inhoud van hoge kwaliteit genieten. Bij MarketScreener zijn alle leden van het team experts in hun domein.
Krijg ik toegang tot MarketScreener op verschillende platformen?
Jawel. Je hebt toegang tot marketscreener.com via de mobiele site of de desktopsite, of via de mobiele iOS-applicatie (deze is gratis bij de Access-formule).
Krijg ik met hetzelfde abonnement toegang tot alle edities (zoals de Franse, de Amerikaanse, de Spaanse, enz.)?
Elke taalversie van onze site staat op zich, met eigen exclusieve inhoud, aangepast nieuws en hoogtepunten (noteringen, markten, enz.) die op maat zijn van het taalgebied. Leden hebben echter toegang tot alle taalversies van MarketScreener nadat ze zich eerst met hun inloggegevens hebben aangemeld op de site met hun taalversie.
Hoeveel aandelen, indexen en noteringen volgen jullie?
Je krijgt toegang tot de meest uitgebreide financiële en beursinformatie op de markt over meer dan 99,9 % van de beursgenoteerde bedrijven ter wereld.
Onze noteringen en analysesystemen, technieken en fundamenten worden dagelijks geactualiseerd en omvatten zo'n 20.000 bedrijven.
Wij volgen ook zo'n 10.000 ETF's en meer dan 280.000 indexen, evenals alle mogelijke noteringen (deviezen, cryptomunten, grondstoffen, noem maar op).
Wie is jullie dataleverancier?
Wij werken samen met 's werelds meest gerenommeerde en betrouwbare leveranciers van financiële data en beursgegevens, zoals Refinitiv, S&P Global, MorningStar, FactSet en vele anderen.
Wat moet ik doen als ik problemen heb met mijn abonnement?
Je kan ons op elk moment bereiken. Onze klantendienst staat tijdens de kantooruren klaar om al je vragen te beantwoorden. Onze klantenservice wordt verleend door échte mensen en experts die je verder helpen bij het gebruik van onze site, zodat je de prestaties van je beleggingen kan optimaliseren.
Wat moet ik doen als ik mijn dienst stopzet?
Wil je graag je MarketScreener-abonnement opzeggen, dan kan dat op elk moment, makkelijk en snel. Klik op de knop "Opzeggen", deze vind je onder Mijn account > Mijn abonnementen.
Welke betaalmethoden accepteren jullie?
Wij accepteren momenteel alle betaal- en creditcards, zoals MasterCard, Visa, American Express, Gpay, Apple Pay. Wij aanvaarden ook PayPal. Alle betalingen worden veilig verwerkt via Stripe of Paypal.
Welke abonnement geeft mij toegang tot de transcripties?
MarketScreener biedt als specialist in beursnieuws toegang tot verschillende soorten inhoud (artikelen, analyses, video's, opleiding, transcripties, enz.). Met een eenvoudig Access-abonnement heb je toegang tot alle transcripties die op onze website worden aangeboden.
De transcripties, een essentieel instrument voor de geïnformeerde belegger, vervolledigen de diepteanalyse van een bedrijf en gaan verder dan de resultatenrekening.
Verlies ik mijn data, lijsten en portefeuilles als mijn abonnement stopt?
Als je abonnement verloopt, heb je niet langer toegang tot de tools en de diensten die in je abonnementsformule waren inbegrepen. Je lijsten, portefeuilles en dergelijke worden echter niet gewist en je kan ze te allen tijde opnieuw raadplegen met een actief abonnement.
Hoe kan ik mijn account wissen?
Omdat wij het bij MarketScreener belangrijk vinden dat je zelf controle hebt over jouw gegevens en het beheer daarvan, kan je op elk moment eenvoudig om de verwijdering van je account verzoeken via ons contactformulier > persoonsgegevens > verwijder mijn persoonsgegevens. Onze klantendienst zorgt er dan onverwijld voor dat je account wordt gewist, hetgeen jou vervolgens per e-mail wordt bevestigd.
Heb je nog andere vragen?
We hopen dat u de antwoorden heeft gevonden waarnaar u op zoek was. Mocht u nog vragen hebben, neem dan contact op met onze klantenservice, bestaande uit echte mensen die experts zijn op het gebied van financiën of hun vakgebied, en die er alles aan zullen doen om al uw vragen op een kwalitatieve manier te beantwoorden.
Zij praten over ons
Opinies van gebruikers
J
Jonas D. Voormalige trader
Voor de fundamentele belegger is Marketscreener een bijzonder instrument: een aandelenscreener om de mooiste aandelen te vinden, financiële data en erg complete informatie over elk aandeel. Door de portefeuilles van Marketscreener te volgen, krijg ik een idee van welke aandelen ik wil (of niet wil) volgen, en de artikelen zijn erg goed gedocumenteerd. Ik zou niet meer zonder kunnen!
d
dirk diggel
Ik had het ongelooflijke geluk Marketscreener te ontdekken! Als volslagen beginneling heb ik veel geleerd dankzij alle informatie en dankzij een geweldig team dat altijd beschikbaar en luisterbereid was. Volgens mij de beste beurssite (goede grafieken, nieuws, de krachtige aandelenscreener, de technische analyses, de tabbladen).
O
Oosterman
Het enige financiële medium waarmee je professionals bereikt die de moeite doen om beschikbaar te zijn. Ik heb al veel bijgeleerd dankzij de begeleiding van de klantendienst. Ik kon zo mijn beurskennis een pak verbeteren! Toegang tot een medium als deze site geeft je een goed idee van de manier waarop vakmensen de markten bekijken.
R
Rafael G. Specialist smallcaps
Marketscreener is in Frankrijk tot dé referentie uitgegroeid voor informatie en voorlichting over de beurs en de financiële markten in het algemeen. Een Bloomberg voor iedereen!
S
Scheibling
Ik ben uiteraard tevreden over de site. Ik gebruik die al sinds de jaren 2000! Ik vind dit de beste beurssite van het moment en sinds 2000, zeer goed gedaan. Krachtige grafieken, al het nieuws, de technische analyses, de tabbladen,... Ik heb uw hulp met de expertgrafieken erg gewaardeerd, men nam de tijd om mij uit te leggen hoe ik deze nieuwe grafieken moest instellen. Van harte bedankt.
C
CG
Erg complete site, noteringen in real-time, nieuws, etc. Perfect om je beleggingen te kunnen volgen.
L
Laura44
Onmisbare site om de juiste keuzes te maken!
M
Marie Lowyck
Op Marketscreener vind ik de financiële info die ik nodig heb.
J
Jojoo
Goed advies, goede follow-up, competente en beschikbare mensen
G
GEELS Filip
Ernstige en zeer goed gedocumenteerde site. De grafieken zijn gemakkelijk te configureren.
L
Louise VENDETTI
Tevreden met mijn aankoop van BE Semiconductor volgens het advies, dit bedrijf verdient aanbeveling bij de langetermijnbelegger.. bedankt!
d
derhy
Uitstekende beurssite met veel tools om je te helpen beslissen. Personaliseerbare en erg intuïtieve screeners. Complete aandelenfiche en sectoranalyse. Ik kan deze onmisbare site ten zeerste aanbevelen.
V
Vera9341
Ik waardeer de inhoudelijke rijkdom van de site en de screener. De andere functies zijn geweldig. Voor de rest is de informatie goed gepresenteerd. De informatie die je zoekt, vind je er meestal ook.
H
Honegger
Marketscreener is vandaag de dag een van de meest complete websites op het gebied van aandelenbeurzen. De site staat vol beursinformatie en de pdf-rapporten over de aandelen zijn erg compleet, maar ik zou zelf meer nadruk leggen op de technische analyses.
V
Van Marke Juliette
Ik ben zeer tevreden over Marketscreener, zoveel informatie op één plek! Ik vind de site uniek, je bespaart een hoop tijd, dat vind ik aangenaam.
B
Boonen
Ik kan de volledigheid van de verstrekte informatie erg waarderen. De sessies via videoconferentie zijn voor mijzelf erg nuttig om de tools beter te begrijpen. De adviezen en posities van MarketScreener over de aandelen lijkt me erg transparant.
J
Jan-Pieter DE NIJS
(Misschien wel) de grootste site voor beursinfo. Zeer groot aantal geanalyseerde bedrijven. Screeners, opmerkelijk effectieve innovaties. Schitterend.
M
Michelle
Dit is de enige site die ik vond en zo compleet is. Met enige moeite vind je er alles wat je zoekt. Ik ben dit jaar alleen wat teleurgesteld dat jullie beleggersportefeuilles niet beter hebben gepresteerd... Niemand heeft een kristallen bol, zelfs de besten niet!
Ze werken met ons samen
Maandabonnement
Jaarlijks
-20%
Access
Informatie en data voor de veeleisende belegger die zelfstandig denkt
Access
-17%
24
29€€/maand
24
29€€/maand
Informatie en data voor de veeleisende belegger die zelfstandig denkt